I’m developing study simulations that require me to generate a sequence of health status for a collection of individuals. In these simulations, individuals gradually grow sicker over time, though sometimes they recover slightly. To facilitate this, I am using a stochastic Markov process, where the probability of a health status at a particular time depends only on the previous health status (in the immediate past). While there are packages to do this sort of thing (see for example the markovchain package), I hadn’t yet stumbled upon them while I was tackling my problem. So, I wrote my own functions, which I’ve now incorporated into the latest version of simstudy that is now available on CRAN. As a way of announcing the new release, here is a brief overview of Markov chains and the new functions. (See here for a more complete list of changes.)
Markov processes
The key “parameter” of a stochastic Markov process is the transition matrix, which defines the probability of moving from one state to another (or remaining in the same state). Each row of the matrix is indexed by the current state, while the columns are indexed by the target state. The values of the matrix represent the probabilities of transitioning from the current state to the target state. The sum of the probabilities across each row must equal one.
In the transition matrix below, there are three states \((1, 2, 3)\). The probability of moving from state 1 to state 3 is represented by \(p_{13}\). Likewise the probability of moving from state 3 to state 2 is \(p_{32}\). And \(\sum_{j=1}^3 p_{ij} = 1\) for all \(i \in (1,2,3)\).
\[ \left( \begin{matrix} p_{11} & p_{12} & p_{13} \\ p_{21} & p_{22} & p_{23} \\ p_{31} & p_{32} & p_{33} \end{matrix} \right ) \]
Here’s a possible \(3 \times 3\) transition matrix:
\[ \left( \begin{matrix} 0.5 & 0.4 & 0.1 \\ 0.2 & 0.5 & 0.3 \\ 0.0 & 0.0 & 1.0 \end{matrix} \right ) \]
In this case, the probability of moving from state 1 to state 2 is \(40\%\), whereas there is no possibility that you can move from 3 to 1 or 2. (State 3 is considered to be an “absorbing” state since it is not possible to leave; if we are talking about health status, state 3 could be death.)
function genMarkov
The new function genMarkov generates a random sequence for the specified number of individuals. (The sister function addMarkov is quite similar, though it allows users to add a Markov chain to an existing data set.) In addition to defining the transition matrix, you need to indicate the length of the chain to be generated for each simulated unit or person. The data can be returned either in long or wide form, depending on how you’d ultimately like to use the data. In the first case, I am generating wide format data for sequences of length of 6 for 12 individuals:
library(simstudy)
set.seed(3928398)

tmatrix <- matrix(c(0.5, 0.4, 0.1,
                    0.2, 0.5, 0.3,
                    0.0, 0.0, 1.0), 3, 3, byrow = T)

dd <- genMarkov(n = 12, transMat = tmatrix, chainLen = 6, wide = TRUE)
dd
## id S1 S2 S3 S4 S5 S6
## 1: 1 1 2 2 1 2 2
## 2: 2 1 1 2 2 2 3
## 3: 3 1 1 2 3 3 3
## 4: 4 1 2 2 1 1 2
## 5: 5 1 1 2 2 2 3
## 6: 6 1 1 1 1 1 1
## 7: 7 1 1 1 1 2 2
## 8: 8 1 1 1 1 1 1
## 9: 9 1 1 2 3 3 3
## 10: 10 1 1 2 3 3 3
## 11: 11 1 2 2 2 2 1
## 12: 12 1 2 1 1 2 1In the long format, the output is multiple records per id. This could be useful if you are going to be estimating longitudinal models, or as in this case, creating longitudinal plots:
set.seed(3928398)

dd <- genMarkov(n = 12, transMat = tmatrix, chainLen = 6, wide = FALSE)
Here are the resulting data (for the first two individuals):
dd[id %in% c(1,2)]## id period state
## 1: 1 1 1
## 2: 1 2 2
## 3: 1 3 2
## 4: 1 4 1
## 5: 1 5 2
## 6: 1 6 2
## 7: 2 1 1
## 8: 2 2 1
## 9: 2 3 2
## 10: 2 4 2
## 11: 2 5 2
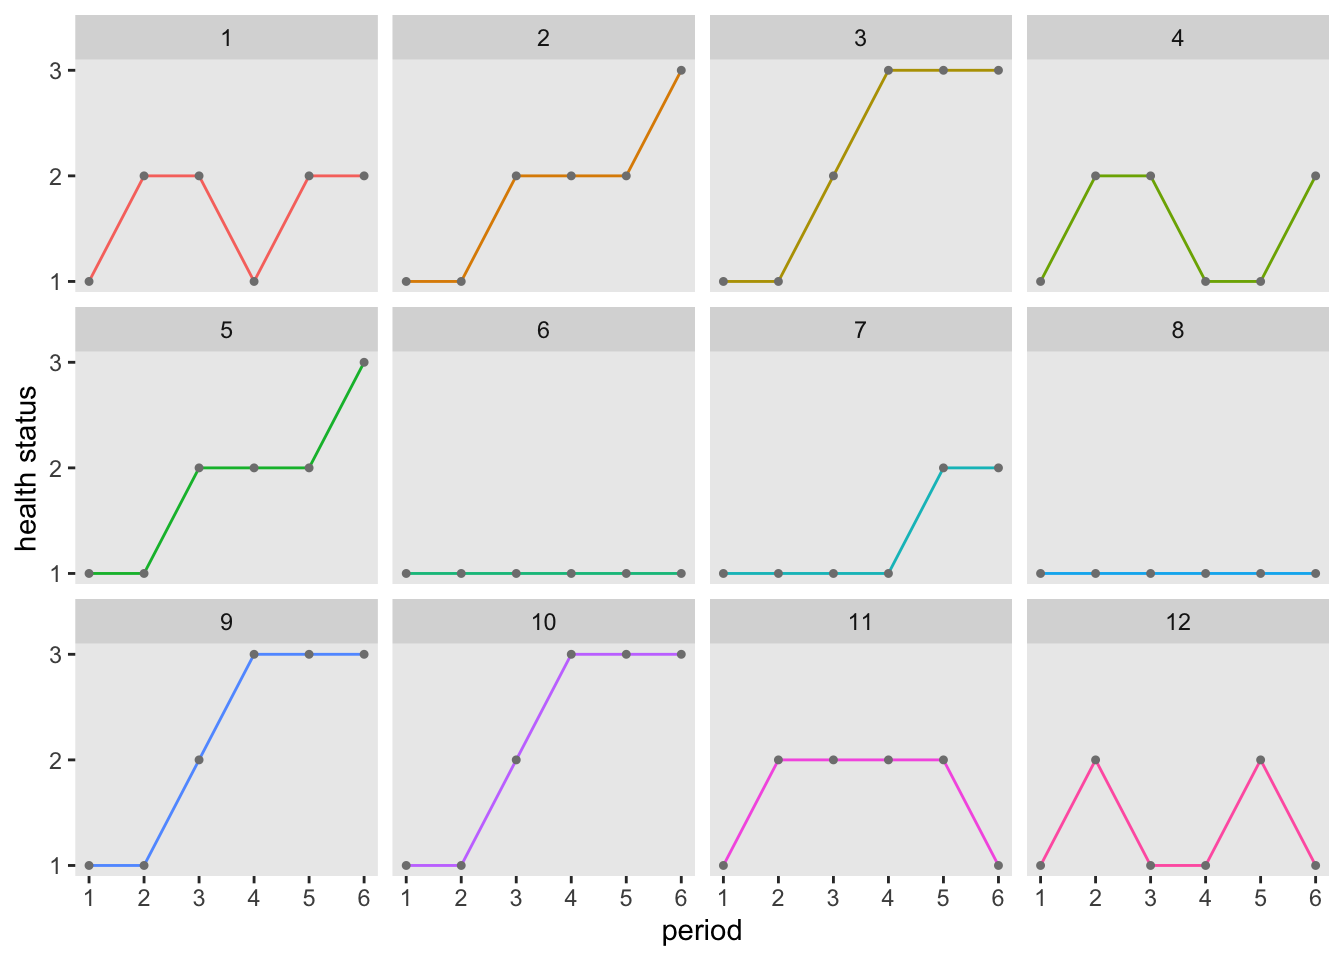
## 12: 2 6 3And here’s a plot for each individual, showing their health status progressions over time:
I do plan on sharing the details of the simulation that inspired the creation of these new functions, though I am still working out a few things. In the meantime, as always, if anyone has any suggestions or questions about simstudy, definitely let me know.